via Apartment List
While a portion of the entire article is pasted below, the full report & similar data and research can be found by visiting, HERE <<
Apartment List National Rent Report
By: Apartment List Research Team
April 27, 2023
Overview
Welcome to the May 2023 Apartment List National Rent Report. Our national rent index increased by 0.5 percent over the course of April. This is the third straight monthly increase in rent prices, but represents a slight slowdown from last month at a time of year when growth is typically picking up steam. This month’s increase was also less than the typical April price change that we saw in pre-pandemic years. Even though prices are trending up again, a combination of sluggish demand and increasing supply is keeping rent growth in check.
Year-over-year rent growth is continuing to decelerate, and now stands at 1.7 percent, its lowest level since March 2021. Year-over-year growth is now below the average rate from 2018 to 2019 (2.8 percent), and it is likely to decline even further in the months ahead.
On the supply side, our vacancy index currently stands at 6.8 percent, surpassing the average pre-pandemic rate and continuing to trend upward. With a record number of multi-family apartment units currently under construction, some property owners may start struggling to fill vacancies for the first time since the early stages of the pandemic.
Rents increased in April in 69 of the nation’s 100 largest cities, down from 83 cities that saw prices rise last month. At the same time, 40 of the top 100 cities are currently logging negative year-over-year growth up sharply from 28 cities last month. New York City saw the nation’s sharpest month-over-month increase, with prices there up by 1.9 percent in April.
Rents nationally increase by 0.5% month-over-month; prices up 1.7% year-over-year
The national median rent increased by a record-setting 17.6 percent over the course of 2021. This rapid growth in rent prices has been a key contributor to overall inflation, which remains top-of-mind for policymakers and everyday Americans alike. While our index has shown that rent growth has been consistently cooling since early last year, the housing component of the official inflation estimates produced by the Bureau of Labor Statistics (the Consumer Price Index, or CPI) is just now appearing to reach its peak.1 This is because movements in market rents lead movements in average rents paid, meaning that our index can signal what is likely ahead for the housing component of CPI.
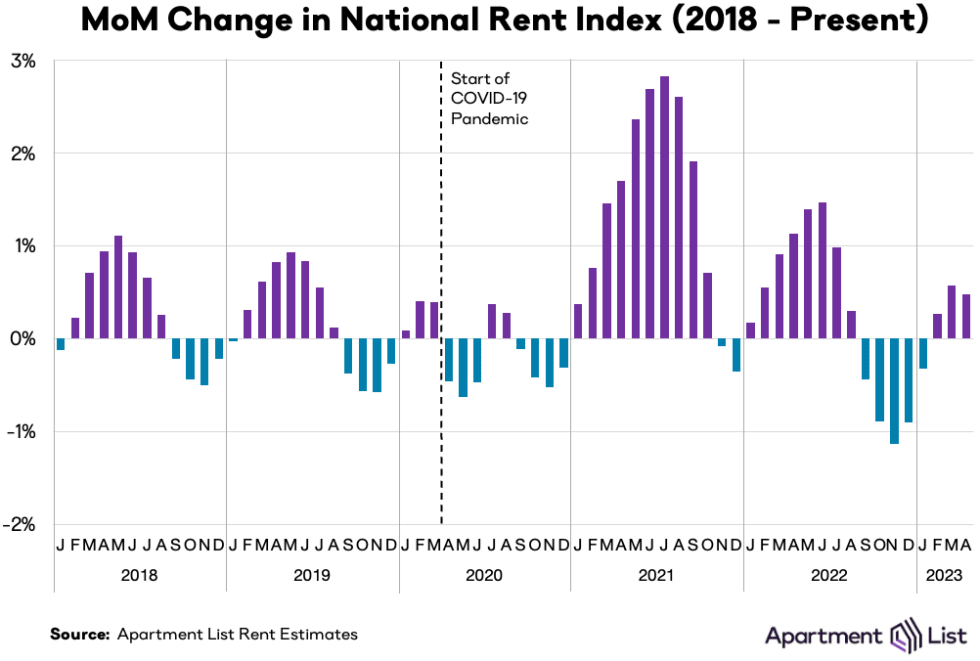
We estimate that the national median rent increased by 0.5 percent month-over-month in April. This marks the third straight month of positive rent growth following a five-month period of prices falling. However, this month’s increase represents a slight slowdown from the 0.6 percent increase we saw in March, bucking the typical seasonal trend. The late spring and summer tend to be the busiest months for the rental market, meaning that rent growth is usually picking up steam at this time of year.
The fact that month-over-month growth fell from March to April indicates that the market cooldown we saw in the second half of 2022 is continuing, even if prices are now trending up. In fact, this month’s 0.5 percent increase was the second slowest April rent growth of any year in the history of our rent estimates (going back to 2017), ahead of only 2020, when prices fell in April amid the turmoil of the pandemic’s onset. From 2017 to 2019, rents increased by an average of 0.9 percent in April, nearly double this month’s increase.
As recession fears continue to grip many Americans, it’s likely that some households are delaying moves, translating to sluggish rental demand. And even if demand rebounds over the summer, a robust supply of new inventory hitting the market this year will continue to keep prices in check. The surging rent growth that we saw in 2021 and the first half of last year is now solidly behind us.
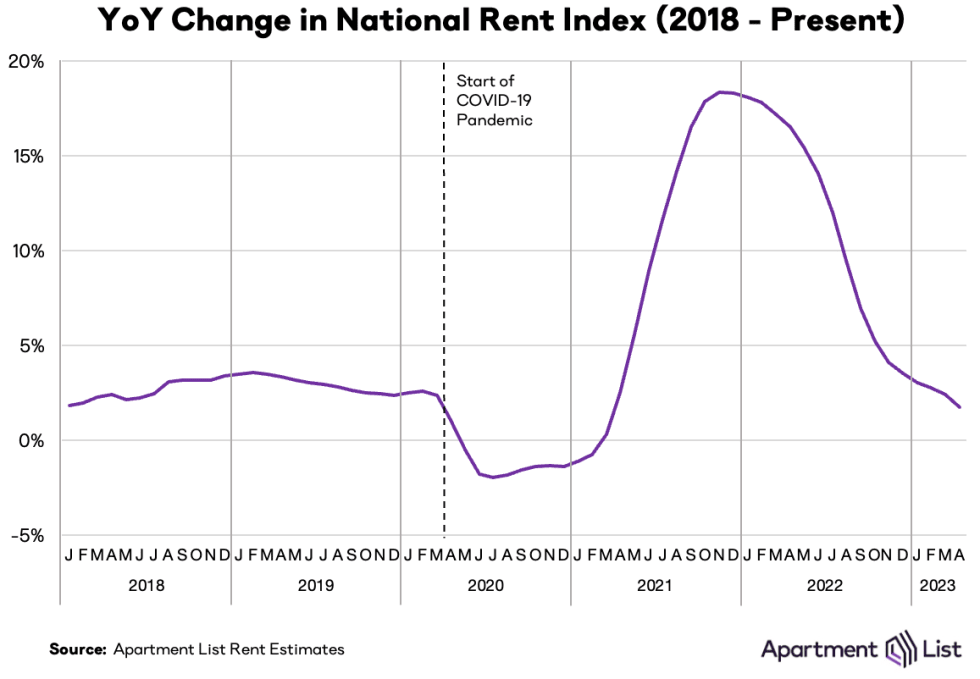
Year-over-year rent growth is continuing to decelerate and now stands at just 1.7 percent, down from 2.4 percent last month. This month marks the lowest year-over-year growth rate that we’ve seen since March 2021, when rents were just starting to rebound from the modest declines of 2020. Year-over-year growth is now solidly below the average rate that we saw in pre-pandemic years; from 2018 to 2019, year-over-year rent growth averaged 2.8 percent. And it’s likely that the year-over-year growth rate will continue to fall in the coming months, as we expect that monthly rent growth this year will continue to be slower than last year through the end of the summer.
Vacancy index rising above pre-pandemic baseline
As we’ve explored in detail, much of the 2021 rent boom was attributable to a tight market in which more households were competing for fewer vacant units. Our vacancy index spiked above 7 percent in the early months of the pandemic in 2020, as many Americans consolidated households and moved in with family amid the uncertainty and economic disruption of the pandemic’s onset. After that, however, rapid household formation drove a sharp tightening of the vacancy rate, which eventually fell to a low of 4.1 percent in fall 2021.
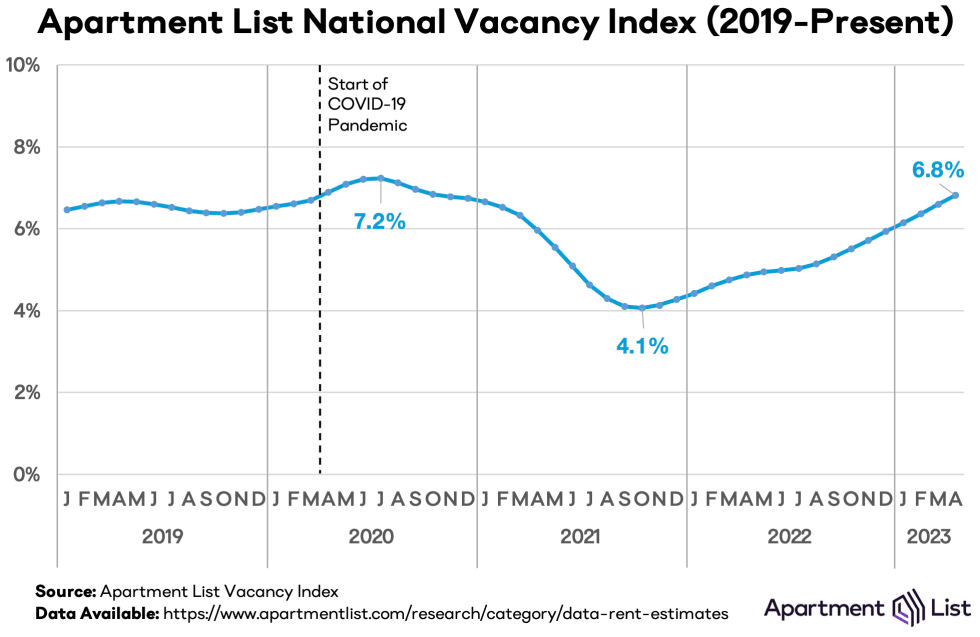
But after bottoming out at 4.1 percent in October 2021, our national vacancy index has been gradually easing for a year and a half, and the rate of easing has picked up steam since last summer. From January through August of last year, our vacancy index was inching up by an average of 11 basis points per month; but from last September through this month, the average increase has been 21 basis points per month. The vacancy rate now sits at 6.8 percent, which is slightly higher than the average 6.6 percent rate from 2018 to 2019.
This easing has shown no signs of slowing, and it’s likely that the vacancy rate will continue to trend even further upward in the months ahead. New apartment construction is recovering from pandemic-related disruptions, and there are now more multifamily units under construction than at any point since 1970. As this new inventory continues to hit the market over the course of the year, we may now be entering a phase in which property owners are competing for renters to fill their units, a marked change from the prevailing conditions of the past two years, in which renters have been competing for a limited supply of available inventory.
Vacancy trends are highly localized, and they have been a key indicator of rapidly evolving conditions in local markets across the U.S. throughout the pandemic. To explore the topic in greater detail, monthly vacancy data are now available for download for hundreds of cities, metros, and states, and can be easily linked to our existing rent estimates using Federal Information Processing System (FIPS) codes.
Rents rise month-over-month in 69 of 100 largest cities; 40 cities have seen prices fall year-over-year
The chart below visualizes monthly rent changes in each of the nation’s 100 largest cities from January 2019 to present. The color in each cell represents the extent to which prices went up (red) or down (blue) in a given city in a given month. In 2020, we can see that rents fell sharply in many of the nation’s largest and most expensive cities, while smaller and more affordable ones picked up steam, leading to some convergence in prices. Meanwhile, the dark red band in 2021 represents the rent heatwave which peaked in July and August 2021 when all 100 cities in this chart saw prices go up. The rightmost columns show the recent cooldown and now the return back to modest positive growth.
While a portion of the entire article is pasted below, the full report & similar data and research can be found by visiting, HERE <<

Leave a comment